For economic commentary and analysis, go to the Bonddad Blog
From the BEA:
Personal saving -- DPI less personal outlays -- was a negative $119.6 billion in February, compared with a negative $115.1 billion in January. Personal saving as a percentage of disposable personal income was a negative 1.2 percent in February, the same as in January. Negative personal saving reflects personal outlays that exceed disposable personal income. Saving from current income may be near zero or negative when outlays are financed by borrowing (including borrowing financed through credit cards or home equity loans), by selling investments or other assets, or by using savings from previous periods.
Here's a graph of the number:
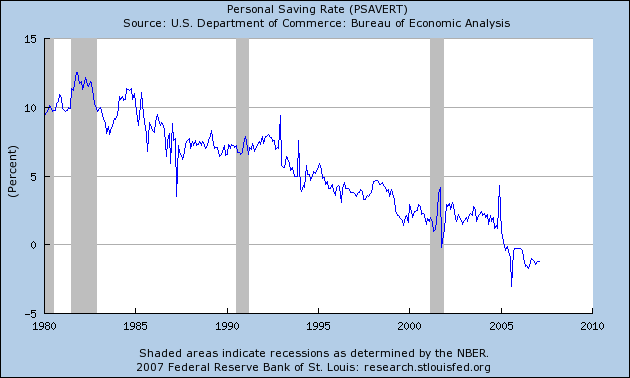
What this data says is simple: in the US we spend more than we make. Therefore, the surplus funds have to come from somewhere. That is usually from previous savings or debt.
Now, there has been a great deal of obfuscation of this statistic from the RWNM, economic division. Their arguments boil down to the following: "We don't like the fact that easy money policies that we promote have led to a dangerous situation, so we'll change the definition so the resulting number won't make our policies look so bad." Let's refute these arguments one at a time.
Home equity is savings.
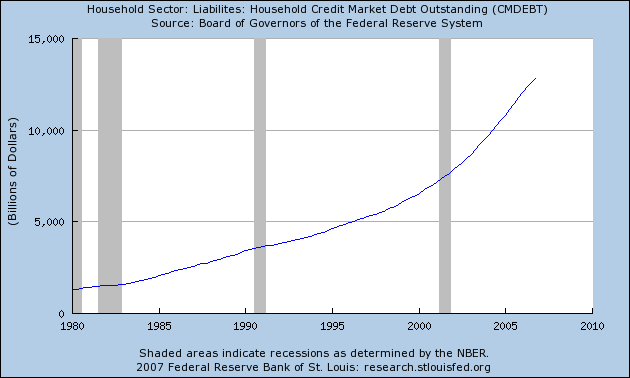
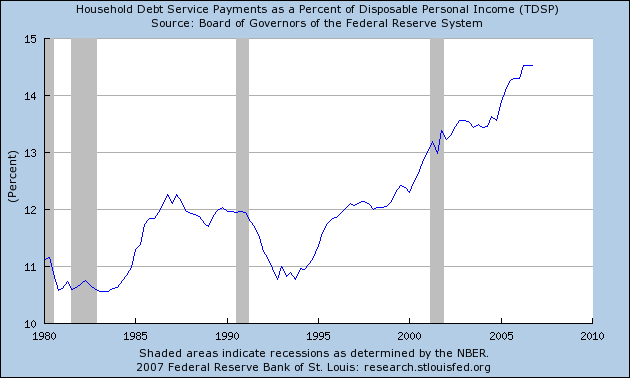
No. Home equity represents ownership, not money set aside for a rainy day. In addition, to access home equity, people have to go into debt. Considering total household debt is now over 90% of US GDP and over 120% of national disposable income, it might not be a great idea for households to increase their debt. Of course, homeowners could always sell their house in the wonderfully booming real estate market.....
In case you were wondering, here's a chart of total household debt outstanding and the household financial obligation ratio. These totals would have to increase to access home equity.
The Savings figures don't include retirement accounts
This is true. The national savings rate is total income minus total expenditures. Therefore, pre-expenditure retirement plans aren't counted. However, according to the Federal Reserve's Flow of Funds report retirement plan savings are still paltry. According to the FOF statement, the seasonally adjusted annual rate of asset acquisition for defined benefit plans has been negative for the last 11 years (see page 112). And the highest the seasonally adjusted annual rate of asset acquisition for defined contribution plans was $88 billion in 1998. That's paltry.
In addition, in 2006 The retirement confidence survey from the Employee Benefit Research Group found that 63% of people had saved less than $100,000 for retirement. That's nowhere near enough for savings.
Household net worth is a better proxy for savings
For misinterpreting this data, Larry Kudlow should forever be confined to hell with nothing but Yanni music playing. First, net worth is not savings -- it's stuff. To get the money these assets represent households have to go into debt or sell the stuff -- whatever it is. In other words, the market will determine when, how and at what value these assets will become liquid. In addition, As the FDIC noted in a report in the Spring of 2006 wealth holdings in the US are heavily skewed to the top 10% of incomes.
While there is no definitive standard for how much a person needs for retirement, many baby boomers appear to have a net worth insufficient to meet basic retirement needs, according to some guidelines.9 In 2004, the median net worth for families headed by baby boomers between the ages of 45 and 54 was $144,700.10 However, these data are somewhat difficult to interpret, as wealth holdings in the United States are skewed toward the top 10 percent of families (see Chart 3, next page). The median family net worth was $1,700 for the lowest 25 percent of U.S. households and $43,600 for those in the 25th to 49th percentile. In contrast, those in the 75th to 89th percentile had median family net worth of $506,800, while the figure for those in the top 10 percent was $1.4 million. These data do not apply only to baby boomers, however. Chart 3 suggests that although many families have a fairly substantial amount of assets, a large number have few resources with which to supplement retirement income.
In other words, incomes in the 75th to 89th percentiles have 11.6 times more assets than households in the 25th - 49th percentile.
Take the above information and coordinate it with re previous information from retirement accounts. What you get is a population woefully unprepared for the proverbial rainy day.
The US economy is consumer dependent. However, this has a cost -- namely that the consumer must continue to spend regardless of the long-term implications. And withing the next generation the implications will be an entire generation with no money to fall back on.
